How to measure network latency using hardware timestamps
2023年10月30日 月曜日

CONTENTS
This post was originally written by Arne Vogel, a PhD student from Germany who has been an intern at IIJ Research Lab during the summer of 2023 working with Pierre-Louis Aublin.
In this post, we explore how to use hardware timestamping to measure network latency more granularly than the simple ping command.
Motivation
Do you want to see the network latency between two nodes?
Simple, use ping:
$ ping node0
PING node0-link-1 (10.10.1.1) 56(84) bytes of data.
64 bytes from node0-link-1 (10.10.1.1): icmp_seq=1 ttl=64 time=0.326 ms
64 bytes from node0-link-1 (10.10.1.1): icmp_seq=2 ttl=64 time=0.315 ms
64 bytes from node0-link-1 (10.10.1.1): icmp_seq=3 ttl=64 time=0.318 ms
64 bytes from node0-link-1 (10.10.1.1): icmp_seq=4 ttl=64 time=0.316 ms
Conceptually, this is what we imagine if we think about the number that ping gives us:
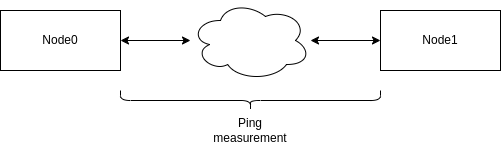
Two machines exchanging ping/pong messages measure the time it takes for a packet to traverse the network between the two machines.
But it is more complicated than that. A lot more stuff is happening to packets sent between the two machines that we don’t capture with this simple conceptual model.
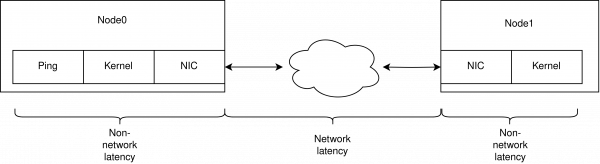
The NIC receives the packet, copies it to main memory via direct memory access (DMA); the kernel processes it and only ends up at the user space application after some additional time.
But what is the breakdown of this additional latency? How much time does the packet spend in the kernel, the network interface (NIC), and the actual network?
The problem: latency measurements, e.g., by ping give us the network latency combined with the latency incurred from the NIC and kernel. For low level optimizations, e.g., for performance critical data center services we want to have a clearer picture of these latency characteristics: how much time does my packet spend in the network and how much between NIC and kernel?
Where should I spend my energy optimizing the latency between two hosts? Should I look into kernel options? Is my NIC slow, or is this latency dominated by the network?
ping does not tell us this information. But we can use another tool, hardware timestamping, to figure out the answer to these questions.
Hardware Timestamping
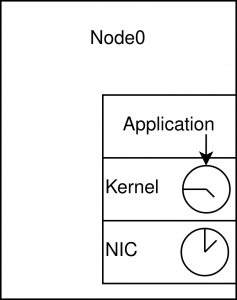
With hardware timestamping, we can instruct the NIC to add the time to a packet as it is received. We can use this time to tell how long a packet was in the network and how long it took to be processed on the machine before our user application got it.
And with the same system call, we can also add kernel timestamping. With this option, the kernel will do the same, adding time to the packet just as it is received from the NIC.
With these numbers, we can get the time the packet took from the NIC to the kernel and then from the kernel to user space.
For the rest of the post, we will assume the interface we use is eth0.
Does my NIC support hardware timestamping?
Not all NICs support hardware timestamping.
To see if your NIC supports hardware timestamping, you can use ethtool:
$ ethtool -T eth0
Time stamping parameters for eth0:
Capabilities:
	hardware-transmit
	hardware-receive
	hardware-raw-clock
PTP Hardware Clock: 2
Hardware Transmit Timestamp Modes:
	off
	on
Hardware Receive Filter Modes:
	none
	all
What we are looking for is the hardware-receive capability.
We have been able to successfully use hardware timestamping on the Mellanox ConnectX-5 25Gb NIC.
Time Synchronization between NIC <-> Kernel
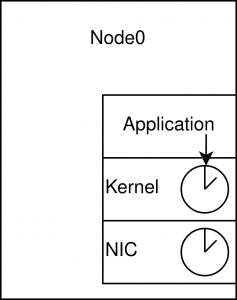
The NIC and the kernel use different time offsets. So, the timestamps we receive from the NIC are useless to our application, as we also use the kernels’ time offset. This is why we need to synchronize the time between the NIC and the kernel before we can interpret the results.
For the synchronization, there is the Precision Time Protocol (PTP).
The PTP protocol is a standardized protocol to synchronize clocks in a network. It can be used to synchronize the clocks between switches and NICs. We, however, only use it to synchronize the clocks between the NIC and the kernel.
Time synchronization using phc2sys
To do the synchronization, we will use phc2sys.
phc2sys is a tool from the Linux PTP Project. It can be found in Ubuntu repositories since version 16.04.
$ sudo apt install linuxptp
$ sudo phc2sys -s eth0 -O 0 -m
This will change the offset of the kernel to the offset used by the NIC.
Example output:
phc2sys[259.181]: CLOCK_REALTIME phc offset 368000329 s0 freq     -37 delay    761
phc2sys[260.182]: CLOCK_REALTIME phc offset 368004374 s1 freq   +4007 delay    761
phc2sys[261.182]: CLOCK_REALTIME phc offset      -990 s2 freq   +3017 delay    761
phc2sys[262.182]: CLOCK_REALTIME phc offset      -995 s2 freq   +2715 delay    762
phc2sys[263.182]: CLOCK_REALTIME phc offset      -706 s2 freq   +2705 delay    761
phc2sys[264.182]: CLOCK_REALTIME phc offset      -383 s2 freq   +2817 delay    761
phc2sys[265.183]: CLOCK_REALTIME phc offset       -83 s2 freq   +2702 delay    761
phc2sys[266.183]: CLOCK_REALTIME phc offset        10 s2 freq   +2623 delay    761
With phc2sys running, it is possible to compare the NIC timestamps against the kernel timestamps, e.g., subtract one from the other to get the latency.
Enabling hardware timestamping with hwstamp_ctl
Hardware timestamping might be possible by the hardware but still needs to be enabled in the kernel.
To enable hardware timestamping, we can use hwstamp_ctl (part of the linuxptp package on Ubuntu).
$ sudo hwstamp_ctl -i eth0 -t 1 -r 1Example output:
$ sudo hwstamp_ctl -i eth0 -t 1 -r 1
current settings:
tx_type 0
rx_filter 0
new settings:
tx_type 1
rx_filter 1
Adding timestamping to an application
Enabling hardware and kernel timestamping:
int enable = SOF_TIMESTAMPING_RX_HARDWARE | SOF_TIMESTAMPING_RAW_HARDWARE |
             SOF_TIMESTAMPING_SYS_HARDWARE | SOF_TIMESTAMPING_SOFTWARE;
int res = setsockopt(sock, SOL_SOCKET, SO_TIMESTAMPING, &enable, sizeof(int));
To receive timestamp information from the kernel in conjunction with the reception of packets, the recvmsg system call is used to receive the data, as in the following program. The point is to specify in the msg_control field of the msghdr structure a pointer to a buffer in user space (in the program control) so that a “control message” can be stored, and the size of that buffer in the msg_controllen field.
struct msghdr msg;
struct iovec iov;
struct sockaddr_in host_address;
char buffer[2048];
char control[1024];
int got;

/* recvmsg header structure */
make_address(0, &host_address);
iov.iov_base = buffer;
iov.iov_len = 2048;
msg.msg_iov = &iov;
msg.msg_iovlen = 1;
msg.msg_name = &host_address;
msg.msg_namelen = sizeof(struct sockaddr_in);
msg.msg_control = control;
msg.msg_controllen = 1024;

/* block for message */
got = recvmsg(sock, &msg, 0);
if( !got && errno == EAGAIN )
    return 0;

handle_time(&msg, cfg);
When the recvmsg system call is executed in the above program, the received data (if any) is written to the specified buffer via the iov associated with the msghdr structure. Timestamp information about the received data is also written to the buffer for the control message associated with the msghdr structure. The timestamp information can be retrieved from this control message as follows: by using CMSG_FIRSTHDR to get a pointer to the first control message and CMSG_NXTHDR, subsequent control messages can be retrieved and processed. In addition, as control messages may contain information other than timestamps, timestamp retrieval is only performed for messages with a message type (cmsg_type) of SO_TIMESTAMPING.
// Extract the timestamp from the message
static void handle_time(struct msghdr* msg, struct configuration* cfg)
{
  struct timespec* ts = NULL;
  struct cmsghdr* cmsg;

  /*
   * The kernel stores control messages for each packet. E.g., on which interface
   * the packet was received on. Or, if as we configured it with the timestamps
   * from the NIC and the kernel.
  */
  for( cmsg = CMSG_FIRSTHDR(msg); cmsg; cmsg = CMSG_NXTHDR(msg,cmsg) ) {
    if( cmsg->cmsg_level != SOL_SOCKET )
      continue;

    switch( cmsg->cmsg_type ) {
    // We are looking for the SO_TIMESTAMPING control message.
    case SO_TIMESTAMPING:
      ts = (struct timespec*) CMSG_DATA(cmsg);
      break;
    default:
      /* Ignore other cmsg options */
      break;
    }
  }

  print_time(ts);
}
With the timespec you can get the timestamp like this:
struct timeval time_user;
gettimeofday(&time_user, NULL);

// The timespec we extracted has three fields.
// ts[0] contains the kernels timestamp
// ts[1] unclear, was 0 in all our testing
// ts[2] contains the NIC timestamp
uint64_t nanoseconds_nic = ts[2].tv_sec * 1000000000 + ts[2].tv_nsec;
uint64_t nanoseconds_kernel = ts[0].tv_sec * 1000000000 + ts[0].tv_nsec;
uint64_t nanoseconds_user = time_user.tv_sec * 1000000000 + time_user.tv_usec * 1000;
For details see the source code at: https://github.com/ArneVogel/hw-timestamping
Example numbers
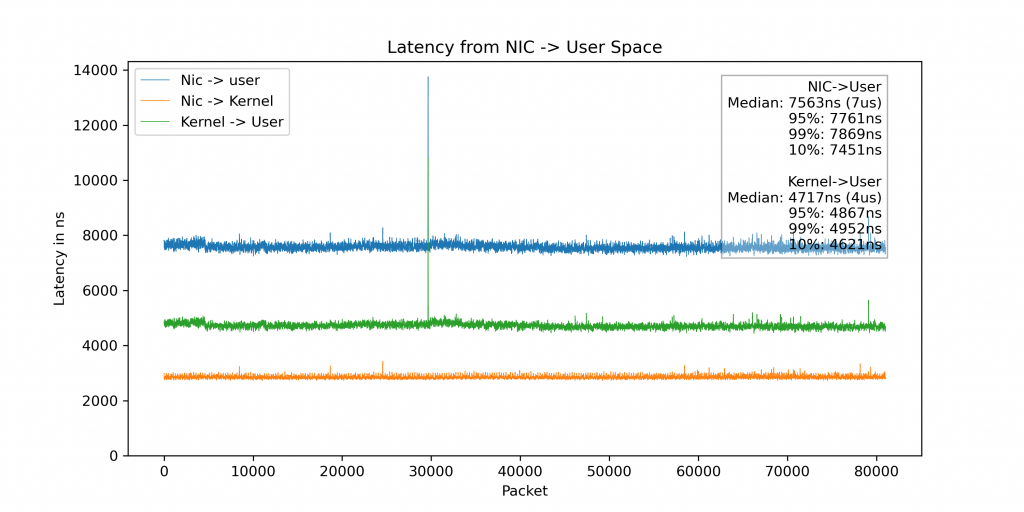
The plot below shows the breakdown of the latency of a packet as it goes from the NIC to the user space application:
Additional plot with added end-to-end latency.
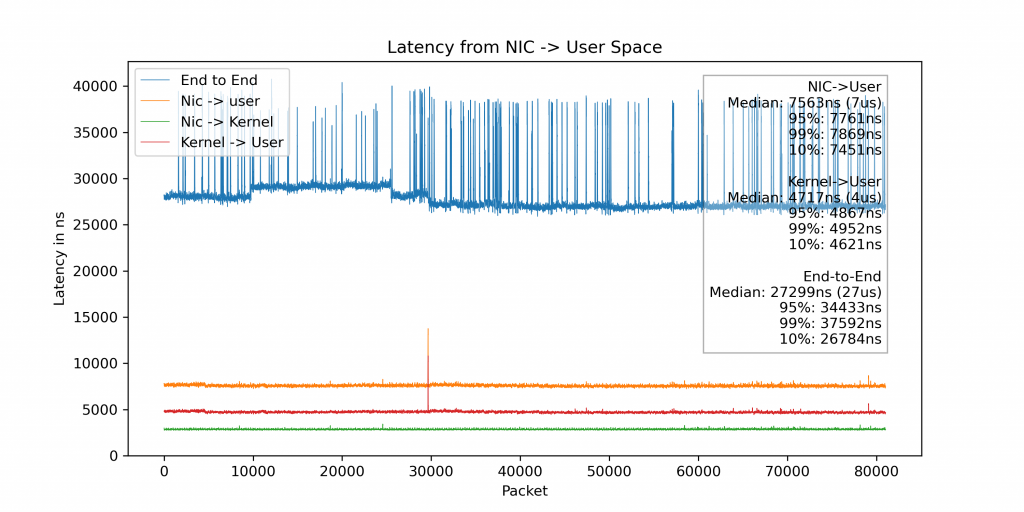
If we look at the breakdown end-to-end, we see that the packet spends a lot more time in the kernel/NIC than one might expect:
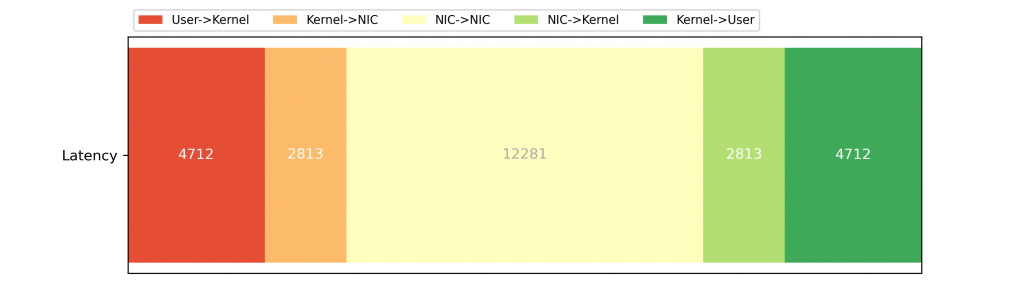
(This plot assumes that sending the packet takes the same time as receiving the packet in the kernel and on the NIC.)
Putting it all together
This experiment uses the example code (hosted at https://github.com/ArneVogel/hw-timestamping) which is an example application and packet generator for the concepts shown in this post.
This assumes node0 and node1 are connected to the same switch.
In terminal 1:
$ # ssh to node0
$ sudo apt install linuxptp
$ sudo hwstamp_ctl -i eth0 -t 1 -r 1
$ sudo phc2sys -s eth0 -O 0 -m
Hardware timestamping is enabled and the NIC<->Kernel time is synchronized on node0.
Starting the logging echo server on node0 in terminal 2:
$ # ssh to node0
$ git clone https://github.com/ArneVogel/hw-timestamping
$ cd hw-timestamping
$ make
$ make run
Now start the packet generator on node1 in terminal 3:
$ # ssh to node1
$ sudo apt install cargo
$ git clone https://github.com/ArneVogel/hw-timestamping
$ cd hw-timestamping/rust-packets
$ sudo cargo run --release eth0
It will take around 20 seconds for the experiment to run. Afterwards you will have latency.txt in terminal 2 and end_to_end_latency.txt in terminal 3.
Generating the plots:
# Rsync the results to a folder containing `hw-timestamping` on your local machine.
# The results are `latency.txt` on node0 and `end_to_end_latency.txt` on node1
$ python3 summarize.py
$ python3 bar_plot.py