The Impact of COVID-19 on Last-mile Latency
2020年12月01日 火曜日

【IIJ 2020 TECHアドベントカレンダー 12/1(火)の記事です】
Last-mile is the centerpiece of broadband connectivity, poor last-mile performance generally translates to poor quality of experience. In our recent research (Fontugne et al. IMC’20) we investigated last-mile latency using traceroute data from RIPE Atlas probes located in 646 ASes and looked for recurrent performance degradation. We found that in normal times Atlas probes in only 10% ASes experience persistent last-mile congestion but we recorded 55% more congested ASes during the COVID-19 outbreak. This deterioration caused by stay-at-home measures is particularly marked in large eyeball networks and certain parts of the world.
Last-mile congestion in large eyeball networks
The below figures depict measured last-mile queuing delay for two major ISPs, Comcast in the US (AS7922) and NTT OCN in Japan (AS4713). The x-axis shows the time of the day (UTC) and the y-axis is the median last-mile queuing delay in milliseconds. Here, we selected four measurement periods, three are in 2019 to understand the usual last-mile latency for these networks before the pandemic and one in April 2020 to measure the impact of the COVID-19 outbreak on last-mile latency.
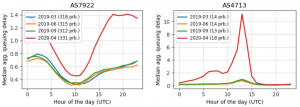
Figure 1: Median last-mile aggregated queuing delay measured with RIPE Atlas traceroute.
In 2019 both networks show consistent daily patterns with a small delay increase during evening peak hours. For Comcast the last-mile latency in 2020 has clearly, but only slightly, increased. The pattern has also changed, higher latencies are observed during both daytime and evening. For NTT OCN the pattern has also changed, but more importantly for this network, the last-mile queuing delays have significantly increased, indicating potential last-mile congestion in this network. This is not unique to NTT OCN, we made similar observations for several Japanese networks, including IIJ (AS2497), and found that Japan is the most impacted country in our study.
Last-mile congestion in Japan
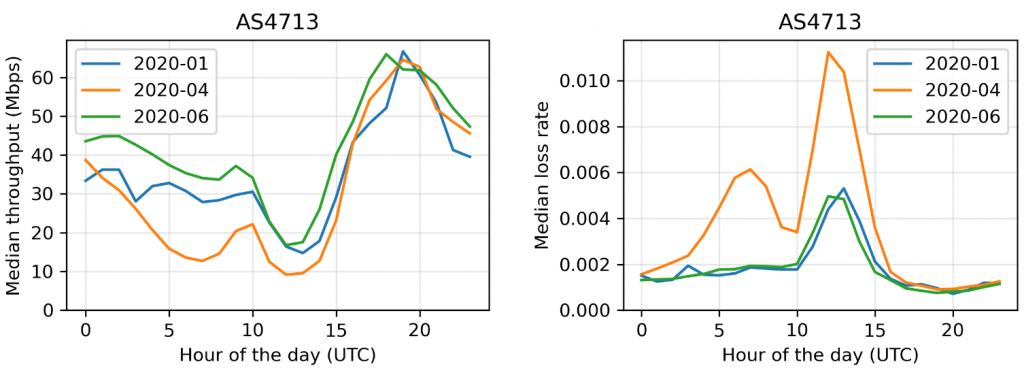
Figure 2: NTT OCN’s median throughput and packet loss as measured by MLab’s NDT data.
With the help of MLab NDT data, we have confirmed the presence of performance degradation during stay-at-home measures. Figure 2 shows the median throughput for clients in AS4713, before (Jan. 2020), during (Apr. 2020), and after (Jun. 2020) the first wave of the COVID-19 pandemic in Japan. The most striking difference is the throughput drop at daytime during the pandemic (orange line from 5:00 to 9:00 UTC). This change coincides with the last-mile delay increases observed with Atlas (Fig.1 right plot) and packet loss surges observed in MLab data (Fig.2 right plot). Notice that these three quantities at that time are at the same level of what we usually observe during evening peak hours before the pandemic.
Interested readers can refer to our research paper for further investigations on Japanese networks. Using CDN log data we compared different access technologies and narrowed down the problem to the extensive use of the shared legacy infrastructure over PPPoE. We also found that wired broadband throughput for some ISPs is consistently lower than LTE during peak hours.
The new normal
From mid-2020 onwards, we however observe better performances than before the pandemic (e.g. green lines in Fig.2). In Japan, this is partly due to the deployments originally planned for accommodating the Tokyo Olympics, and more generally, it reflects the efforts of network operators to cope with these exceptional circumstances. The pandemic has demonstrated that its adaptive design and proficient community can keep the Internet operational during such unprecedented events. Also, from the numerous research and operational reports recently published, the pandemic is apparently shaping a more resilient Internet, as Nietzsche wrote, “What does not kill me makes me stronger”.
See also
- More details about this work are available in our IMC publication and presentation video.
- All results and source code are available at https://last-mile-congestion.github.io/.